Unit Testing in DevOps: A Practical Guide
Author: Niranjani Manoharan
Published: December 10, 2021

Table of Contents
As quality engineers, we're ready to test applications in the staging environment. But what happens before code lands there? Understanding the development lifecycle—from commit to production—shapes our testing strategies. This understanding starts with unit testing in DevOps. Let's explore the tools and technologies—including AWS, Terraform, Docker, Ansible, Grafana, and Kibana—that drive this process. We'll also tackle the key question: what is the definition of a unit test from a DevOps perspective? Follow along to discover the behind-the-scenes magic of software development.
In this article, we follow code from the moment it’s committed into the version control system, through testing, and into production.
When do we use Amazon Web Services?

AWS and DevOps Unit Testing
Amazon Web Services (AWS) provides a robust ecosystem for DevOps practices, and it plays a crucial role in facilitating efficient unit testing. Think of unit testing as the foundation of your testing strategy—verifying that individual components of your code work as expected before they're integrated into the larger system. This is where AWS steps in, offering tools to automate and streamline the entire process.
CodePipeline for CI/CD Integration
Integrating unit tests into your CI/CD pipeline is key for catching issues early. AWS CodePipeline is a service that helps you automate this. Imagine this: a developer commits code, and CodePipeline automatically triggers your unit tests. If the tests pass, the code moves on to the next stage of the pipeline. If they fail, the pipeline stops, and the developer receives immediate feedback. This prevents bugs from becoming larger problems, saving you time and headaches.
CloudWatch for Test Monitoring
Monitoring the performance of your unit tests is just as important as running them. AWS CloudWatch gives you real-time insights into how your tests are performing. You can track metrics like test execution time, pass/fail rates, and even set up alerts to notify you of any anomalies. This level of visibility helps you identify bottlenecks and optimize your testing process for maximum efficiency. Think of it as having a constant pulse on the health of your code.
Other AWS Services for Testing
Beyond CodePipeline and CloudWatch, AWS offers a suite of services that can improve your unit testing strategy. AWS Lambda lets you run serverless tests, eliminating the need to manage servers. AWS CodeBuild compiles your code and runs your tests in a managed environment. And AWS CodeDeploy automates deployments, ensuring that your tested code gets to production quickly and reliably. These services work together to create a comprehensive testing ecosystem, giving you the confidence to release high-quality software. .
These days a lot of companies host and deploy their applications on Amazon Web Services (AWS). What does this mean? AWS is the infrastructure used to enable end-users to request, receive, and interact with your application. So, if your application is running on AWS, then when a pull request (PR) is merged and the changes are deployed to staging, these changes are deployed to an Amazon EC2 (Elastic Compute Cloud) instance that is running a Linux/Mac OSX. AWS lets you monitor the status of these deployments.
Terraform

Terraform for Infrastructure as Code (IaC)
Terraform is an open-source tool that lets you define and manage your infrastructure as code (IaC). Instead of manually configuring servers, networks, and other infrastructure components, you describe them in configuration files. Terraform then uses these files to automate the provisioning and management of those resources. This declarative approach offers several benefits for managing test environments, especially within a DevOps framework.
Managing Test Environments with Terraform
Terraform simplifies creating and managing test environments. It allows developers to easily spin up and tear down environments whenever needed, which is crucial for continuous integration and continuous deployment (CI/CD) practices. Imagine needing to test a new feature in an environment that mirrors production. With Terraform, you can quickly provision a replica environment, run your tests, and then deprovision it after testing is complete—saving time and resources. This dynamic provisioning capability is a game-changer for teams looking to accelerate their testing cycles.
Integrating Terraform with CI/CD pipelines automates testing and deploying infrastructure changes. This ensures that test environments are always up-to-date and reflect production. Automating these processes reduces the risk of human error and increases the speed of deployment. Plus, versioning your infrastructure configurations with Terraform, just like application code, allows teams to track changes, roll back to previous versions, and collaborate more effectively. This version control adds another layer of reliability and control to your infrastructure management.
Using Terraform for IaC offers a more efficient and reliable way to manage test environments. By automating the provisioning, management, and tear-down of these environments, teams can focus on delivering high-quality software faster and with greater confidence. If your team struggles with complex or time-consuming test environment management, exploring Terraform might be a worthwhile investment.
Terraform helps define server infrastructure for deploying software. The configuration to provision, modify, and rebuild an environment is captured in a transparent, repeatable, and testable way. Used correctly, these tools give us the confidence to tweak, change, and refactor our infrastructure easily and comfortably.
Docker for Consistent Test Environments
Let’s talk about Docker. Docker uses containers to package software. These containers bundle everything an application needs—code, system tools, libraries, and settings—into a single package. This ensures that the application runs reliably across different computing environments, regardless of the underlying infrastructure. This is incredibly useful for testing, as it helps eliminate those pesky "it works on my machine" scenarios. By packaging the application and its dependencies together, Docker guarantees consistency between development, testing, and production environments. This consistency is key for reliable and repeatable test results.
Think of it like baking a cake. You have a recipe (your code) and ingredients (your dependencies). Without Docker, it's like trying to bake that cake in a different kitchen every time, with different ovens and ingredient brands. The results might vary wildly. Docker provides a standardized kitchen (the container) with all the necessary equipment and ingredients pre-measured. This ensures that no matter where you "bake" your application, the outcome will be consistent.
Containerizing Unit Tests
Unit testing involves testing individual components of an application in isolation. It's like checking each ingredient of your cake before mixing them together. Unit testing is typically automated for speed and efficiency. Docker enhances unit testing by providing isolated and consistent environments for these tests. Each unit test can run within its own container, ensuring that dependencies and configurations don't interfere with the results. This isolation is crucial for accurate and reliable test outcomes. Using Docker for unit testing helps create environments that closely resemble production, further reducing the risk of unexpected issues later on.
When using Docker for unit testing, it's best to create lightweight containers containing only the necessary dependencies for the tests. This approach, similar to prepping only the ingredients you need for a specific recipe, streamlines the testing process, making it faster and more efficient. By integrating unit tests into CI/CD pipelines, you automate the testing process, catching bugs early in the development cycle. This early detection saves time and resources, contributing to a more efficient and robust development workflow.
Let’s define stack to refer to a set of infrastructures that are defined and managed as a single unit. This corresponds to a Terraform state file. So, with Terraform, we can define how these environments will be designed in one of three ways:
- Put all the environments into a single stack.
- Define each environment in a separate stack.
- Create a single stack definition and promote it through a pipeline.
Ansible for Test Automation and Orchestration
Ansible is a powerful tool for automating and orchestrating testing. It streamlines configuring and managing test environments, deploying applications, and executing tests, reducing manual work and ensuring consistency. Think of it as a conductor for your entire testing symphony.
One key benefit of Ansible is automating repetitive tasks. Instead of manually configuring servers, installing software, or running tests, you can write Ansible playbooks that define these tasks declaratively. This saves time and minimizes human error, leading to more reliable and repeatable test results. Ansible’s strength lies in its simplicity and agentless architecture, making it easy to learn and implement across different operating systems and platforms. Red Hat offers a good overview of Ansible.
Ansible’s idempotency is a game-changer for testing. This means you can run the same playbook multiple times, and it will only apply the necessary changes to reach the desired state. This is crucial for consistent test environments, giving you confidence that your infrastructure is always configured correctly.
Ansible excels at orchestration. It lets you manage complex deployments across multiple environments, ensuring all components are in sync before tests run. This is especially valuable in a microservices architecture, where you might have many interconnected services that need to be deployed and configured correctly. Learn more about Ansible's orchestration capabilities.
Integrating Ansible into your CI/CD pipeline further amplifies its benefits. Automating application deployments and test execution accelerates the feedback loop and improves collaboration between development and operations teams, leading to faster releases and higher-quality software. Ansible’s blog has a helpful post on using it for test automation.
Finally, Ansible simplifies managing test environments. With Ansible playbooks, you can quickly spin up and tear down test environments, ensuring you're always working with the latest code and configurations. This is essential for effective testing, allowing you to catch issues early. If you're looking to improve your testing process, explore how Ansible can help you achieve greater efficiency and reliability.
In a nutshell, the first approach yields poor results; the second approach works well for simple setups (two or three environments, with not many people working on them), and the third has more moving parts but works well for larger and more complex groups.
Grafana for Visualizing Test Results
Grafana is an open-source platform for monitoring and observability. It lets you query, visualize, alert on, and understand your metrics no matter where they're stored. Create dashboards and share them with your team. Think of Grafana as a central hub for all your testing data, bringing information from different sources into a clear, concise view.
When it comes to testing, Grafana can pull data from various testing tools and present it in interactive dashboards. Imagine seeing trends in your test execution times, pass/fail rates, or the performance of specific test suites. This real-time insight helps identify bottlenecks, track progress, and make data-driven decisions to improve your testing process. You can get started with Grafana easily, with plenty of online resources to help customize it to your needs.
For example, configure Grafana to visualize test results from IBM DevOps Test Hub or integrate it with tools like Keploy for real-time monitoring. By querying this data, you can create graphs, statistics, or tables within Grafana, offering detailed analysis and spotting trends over time. This is incredibly helpful for identifying areas for improvement in your testing strategy.
With the first approach, multiple environments are managed as a single stack. In this case, when you make a change in the staging environment, it impacts production down the line. For example, we turn ON a feature flag on staging; given the single stack setup, this could result in having the feature flag turned ON in production by default unless you override this configuration.
With the second approach, since each environment is isolated, replicating the changes between environments requires vigilance and consistency. Otherwise, over time, these environments become snowflakes or isolated entities.
Kibana for Log Analysis and Test Debugging
Think of Kibana as your detective’s magnifying glass for application logs. In the fast-paced world of DevOps, where code changes are frequent and deployments are rapid, understanding what's happening under the hood is critical. Log analysis plays a crucial role, providing insights into application behavior and helping diagnose issues quickly. Kibana, a powerful visualization tool, empowers teams to analyze logs in real-time, making it easier to identify problems during testing and in production, as highlighted by Logz.io.
Kibana's strength lies in its visualization capabilities. It transforms raw log data into interactive dashboards and charts, revealing trends and anomalies that might otherwise go unnoticed. Imagine trying to find a needle in a haystack—that's what debugging can feel like without the right tools. Kibana helps you visualize the "haystack" and pinpoint the "needle" quickly, especially during testing when understanding the context of failures is essential for faster resolutions. Elastic emphasizes this, showcasing how Kibana's visualizations can expedite the debugging process.
Kibana is a key component of the ELK Stack (Elasticsearch, Logstash, Kibana), a popular combination of tools used for centralized log management in DevOps. This integration allows for seamless data flow—from ingestion and storage in Elasticsearch to visualization in Kibana. This streamlined process enables teams to maintain high-quality applications by providing a comprehensive view of their log data. This is especially helpful when trying to achieve complete test coverage within a short timeframe.
Real-time monitoring is another valuable feature offered by Kibana. Teams can set up dashboards that display live application logs, enabling proactive debugging. This is like having a live feed of your application's health, allowing you to address issues before they impact end-users. Elastic's documentation provides a deeper dive into Kibana's real-time monitoring capabilities. Consider pairing these monitoring features with a robust test automation solution for comprehensive quality assurance.
Finally, Kibana promotes collaboration. Its visualizations and dashboards can be easily shared across teams, fostering a shared understanding of log data. This is particularly helpful between developers and quality engineers, leading to more effective debugging and testing processes. Logz.io discusses how Kibana improves collaboration in DevOps environments. This collaborative approach aligns well with the principles of efficient QA services.
With the third approach, we use a single file to create multiple stack instances in a pipeline.
- A change is committed to the source repository.
- The continuous deployment server detects the change and puts a copy of the definition files into the artifact repository, with a version number.
- The continuous deployment server applies the definition version to the first environment, then runs automated tests to check it.
- The automated script on the continuous deployment server is triggered to apply the definition version to production.
This setup ensures that every change is applied to each environment. The versioning helps maintain consistency and sanity, especially when facing production issues. In addition, it makes it so much easier to debug!
Docker
Let’s say your application needs a web server. Terraform helps configure servers, but we need some infrastructure to run these servers. In this case, we will use 2 AWS EC2 instances. One will run our Jenkins CI server, and the other will be configured for Docker to run microservices and the web application.
With Docker Compose, you can define and run multiple container docker environments. The Compose file is like a configuration file that lets you configure your application services and start and stop services. Compose allows you to create multiple isolated environments and helps to test your changes locally. For example, you could potentially add the configuration details for the dependencies like databases, caches, web services, and more in a Compose YAML file. Then you’ll be able to create and start one or more containers for each dependency with a single docker-compose command. This simplifies environment creation for developers.
We can also extend this use case for automated testing. You just need to define the entire testing environment in your YAML file, and viola – you run your tests and then destroy it!
Ansible

Now that we have our EC2 instances created, we can configure them using Ansible. Ansible is used to automate the process of configuring machines to run any processes or servers. Basically, if you need to deploy an updated version of the server on all the machines in your enterprise, then you just need to add the IP addresses of the nodes (or remote hosts), write an Ansible playbook to install it on all nodes, then run the playbook from your control machine.
Returning to our example of running Jenkins on one of our EC2 instances, we need to install its dependencies. This can be easily configured and provisioned by updating the /etc/ansible/hosts file.
Similarly, we need to add the commands required to run our web server in our docker container using the ansible configuration file on the second EC2 instance.
In this example, we only used two EC2 instances. However, in a complex application, we would need to provision multiple EC2 instances for databases, caches, etc. In that scenario, Ansible’s automated workflow capability helps to make orchestrating tasks easy. Once you’ve defined your infrastructure using the Ansible playbook, you can use the same orchestration wherever you need to, as Ansible playbooks are portable.
Grafana

Now that we discussed how developers’ code travels to different environments, what happens after we deploy to staging and start running our automated tests? How do we track and monitor our test runs effectively?
Let’s discuss how we can leverage logging and monitoring tools for testing and automation. First, we’ll address the misconception that these tools are useful only for developers.
Let’s assume you have some automation added, and now you’re trying to share the progress with your leadership team. The number of tests automated alone doesn’t add much value other than showcasing test coverage. Usually, test automation efforts get siloed in companies. We can break those silos by leveraging metrics like the number of hours saved by automation vs. manual testing and the test pass % info being represented via Grafana dashboards. This will give more confidence to the leadership team that automation is adding value, and we can scale our testing efforts seamlessly.
Grafana uses Wavefront Query Language (WQL), which lets you retrieve and display the data that has been ingested into Wavefront. In my blog post, you can learn more about using time series data and displaying data in a graphical format. You can also add alerts if the test pass % falls below a threshold value.
Kibana

Let’s say the developer’s changes have been deployed to production, and now you’re encountering issues. How would you go about debugging? There are several tools that are leveraged by companies these days, like Loggly, Kibana, etc. We will limit the scope of this discussion to Kibana.
Kibana is part of the ELK (Elastic search + Logstash + Kibana) stack. This collection consists of 3 open-source projects wherein:
- Elastic search is a full text-based search and analysis engine.
- Logstash is a log aggregator which collects and processes data from multiple sources, converts, and ships them to Elastic search.
- Kibana provides a UI to allow users to visualize, query, and analyze their data.
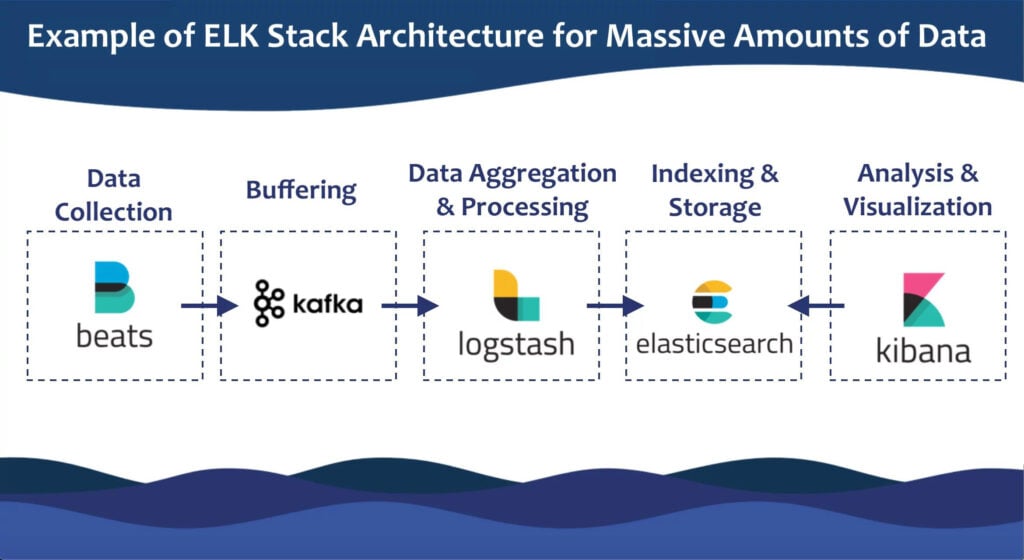
There may be multiple ELK nodes aggregated to support the complex architecture in a large-scale enterprise company and may also require additional components like Apache Kafka for buffering and Beats for data collection.
Kibana enables you to search, filter, and tail all your logs ingested into Elasticsearch.
So, if you don’t see logs for a specific event, there could have been multiple errors starting from data collection to buffering and data processing that happens in Logstash vs. the absence of logging events in the codebase!
Please refer to my recent talk for Test Tribe Community, where I do a live debugging session using Kibana.
Expanding Quality Engineers’ Horizon
As quality engineers, we test in different environments, starting with staging, pre-production, and production. If you see inconsistencies between your environments, you should be able to easily narrow down the issue to Terraform configurations or the Ansible playbook/module not updated correctly. Creating a good understanding of our observability stack using tools like Grafana and Kibana will help you improve logging and monitoring at your current workplace. Understanding how things work behind the scenes will aid in debugging issues not necessarily within the scope of the quality team. It also helps to expand your scope about how things work and are interconnected. This knowledge should help reduce your dependency on the DevOps/Observability/SRE team to identify the issue. Instead, you can help their team by identifying the issue for them.

Frequently Asked Questions
How can I integrate unit testing into my CI/CD pipeline using AWS?
AWS offers several tools to automate this process. CodePipeline can trigger your unit tests automatically when code is committed. If tests pass, the code moves to the next stage; if they fail, the pipeline stops, providing immediate feedback to the developer. You can also use CloudWatch to monitor test performance, track metrics, and set up alerts. Other AWS services like Lambda, CodeBuild, and CodeDeploy can further enhance your testing and deployment process.
What are the benefits of using Terraform for managing test environments?
Terraform allows you to define your infrastructure as code, automating the provisioning and management of your test environments. This makes it easy to create and destroy environments on demand, which is essential for CI/CD. Terraform also enables version control for your infrastructure, allowing you to track changes and roll back to previous versions if needed. This leads to more efficient and reliable management of your test environments.
How does Docker improve the consistency and reliability of my tests?
Docker containers package your application and its dependencies together, ensuring consistent execution across different environments. This eliminates inconsistencies between development, testing, and production, leading to more reliable and repeatable test results. Docker also provides isolated environments for unit tests, preventing dependencies from interfering with test outcomes.
Why is Ansible useful for test automation and orchestration?
Ansible automates repetitive tasks like configuring servers, installing software, and running tests, reducing manual effort and ensuring consistency. Its idempotency ensures that running the same playbook multiple times only applies necessary changes, maintaining the desired state of your test environments. Ansible also excels at orchestrating complex deployments across multiple environments, keeping everything in sync before tests run.
How can Grafana and Kibana enhance my testing process?
Grafana helps visualize test results by pulling data from various testing tools and presenting it in interactive dashboards. This allows you to track trends, identify bottlenecks, and make data-driven decisions to improve your testing process. Kibana, on the other hand, helps analyze application logs, providing insights into application behavior and assisting in debugging. It transforms raw log data into interactive dashboards, making it easier to identify and resolve issues during testing and in production.
Niranjani is a software engineering lead for industry pioneers such as Lyft, eBay, and Twitter. A speaker and trailblazer, she was recently featured among Agile Testing Days' "100 Women in Tech to Follow and Learn From". Niranjani often shares on her Twitter, website, or blog, as well as in different conferences and podcasts she's invited to.
Related Posts:

AWS Infrastructure Testing: A Practical Guide
Unstable testing environments: a headache for any quality team. Whether you're running manual or automated tests, a flaky environment blocks progress. This hands-on guide tackles AWS infrastructure...

New Trends in Software Testing: AI, DevOps & More
Explore new trends in software testing that are transforming QA practices. Learn how automation, AI, and emerging technologies are shaping the future of testing.
Continuous Testing: The Complete Guide for Dev Teams
Learn how continuous testing can enhance software quality and speed up development cycles. Discover key practices and benefits for your team.