-
Not all metrics matter: Vanity metrics, such as raw bug counts or test case totals, may look impressive, but they rarely improve quality or inform decision-making.
-
Focus on actionable QA metrics: Track escaped defects, turnaround time, stability of user journeys, and customer-reported issues because these reveal real risks.
-
Align metrics with business goals: Metrics should connect software testing outcomes to product adoption, customer satisfaction, and reputation.
-
Tell a story with data: Executives want context, not raw numbers. Pair dashboards with insights, commentary, and trends to build trust.

Measuring software quality with numbers can feel like a complex game. Bug counts. Test cases. Coverage percentages. Reports full of data that glow brightly but convey nothing. As a leader, it is important to know that the numbers that reach you tell the truth. In the world of software, teams often collect metrics and data points because they are easy to measure and track. This often leads to metrics that don’t really help testing or testers.
That’s the hidden trap of metrics. Most metrics may look pretty, but they are often pointless.
Let’s be clear: not all metrics are created equal. Some guide you, whereas some mislead you. Some give insight. Some expose hidden QA risks. This article shows which metrics make a difference and which are a waste of your time. In this article, we will learn how to focus on actionable measures, avoid metric traps, and use meaningful metrics to make smarter decisions.
Why Most Software Testing Metrics Fail to Improve Quality
Metrics appear to be objective in nature. They aren’t. Metrics only work if they reflect what truly matters. Otherwise, they end up creating unnecessary noise.
Let’s take tester productivity, for example. Many teams measure it by the bugs reported by a tester. It is easy to count them, yes! But what does it really show?
Think deeper. In most cases, it can mislead people. A tester may log fewer bugs because the system has not undergone significant changes. Or because they’re digging into risk-heavy workflows where bugs hide deeper. Or because they’re spending time thinking instead of actually executing tests. It could also mean the software is solid or the bugs are harder to find. None of that shows up in raw counts.
Counting bugs is simple. Meaningful? Not always.
The worst part of bad metrics is that they can distort behavior. When metrics such as bug counts are put into place, people chase the number rather than the goal. It may lead to people hunting and reporting easy bugs and not diving deep for critical risks, as it may take up more time. This way, metrics create a dysfunction in the system.
Measure the wrong thing, and people will optimize their numbers for the metric, and not the goal. This is similar to how school students optimize for examinations over real learning. In the long run, the reports look good, but the product doesn’t.
Vanity Metrics vs. Actionable QA Metrics
Not everything that can be measured deserves your attention. Many factors can make dashboards look impressive, but they don’t provide actionable insights. They are vanity metrics. Such metrics may look impressive, but they don’t influence decision-making. They’re the kind of numbers that fill reports yet leave teams no wiser. Shiny. Empty. Deceptive.
Common example of vanity metrics:
- Bug counts without context
- Test case count without understanding coverage
- Coverage percentages without risk insight
On the other hand, actionable metrics tell you something real. They reveal gaps. They give you information to act upon and drive better decision-making.
Examples of actionable metrics are:
- Escaped defects
- Defect turnaround time
- Stability of user journeys
- Customer reported issues with new features
Actionable metrics are straightforward. They demand attention. They don’t just stop at measuring; they also guide the user.
Metric test: Ask yourself, “Does this metric help me improve my testing or guide decision-making?” If the answer is no, it’s probably a vanity metric.

How to Align QA Metrics with Business and Product Goals
Metrics only matter when the business cares about them. This is why metrics must reflect business priorities. They should connect with the product goals. Understanding business costs is the first step towards defining meaningful metrics. The failure costs can be classified into two major categories:
- Internal: These come from overhead issues, tasks, and tech debts created before the product release. It usually results in rework, delays, and unnecessary headaches.
- External: These come from defects and issues reaching end customers. This typically results in reputational damage, complaints, emergency hotfix releases, and a loss of user trust.
Tracking meaningful metrics reduces both. It focuses efforts where it matters the most. It improves quality. It protects reputation.
In the early stages of my career, I worked on a project where the testing department was evaluated based on bug counts. Meanwhile, the product team measured success by feature adoption. This mismatch led to quick chaos. Testers logged endless minor bugs. This left the features that drove adoption under-tested.
Eventually, when we shifted our focus from total bug count to customer-reported issues in new features and the stability of critical workflows, everything changed. Suddenly, testing and product spoke the same language. Trust grew. Now, our metrics were meaningful for the business and aligned with our long-term product goals.
Top QA Metrics That Build Trust with Business Executives
Business executives don’t want raw data collection. They care about insights. They want context. They want confidence. They want to ensure that risks are identified, that customers are protected, and that the team is in control of software quality.
So, tell a story. An effective QA metric should convey a story. It should show:
- What matters most to the business
- What the team is doing to mitigate risk
- How testing outcomes impact customer experience
Here are some personal tips to showcase metrics meaningfully:
- Use visual cues. Visual cues invoke the visual intelligence of your audience.
- Plot your dashboards with RAG status (red/amber/green) to help executives understand risk at a quick glance.
- Add commentary to explain risks and special areas.
- Include contextual notes and inferences: why a metric is trending, what corrective actions are underway, and lessons learned.
- Accompany metrics with a one-page summary or overview.
- Live dashboards can be tempting, but they often don’t show the context behind the numbers. Add context to live dashboards wherever possible.
- Share the top lessons learned from the metrics and data collection efforts. This showcases the value of all the efforts put in for the QA metric work.
Metrics are tools, not judgments. They illuminate reality. They guide decisions. They reduce risk. If misused or used without context, they can easily mislead. Keep revisiting your metrics regularly. Use the PIC heuristic to review your metrics quickly:
- Purpose (P): Why was this metric chosen in the first place? What purpose does it solve?
- Improvement (I): How does it help us improve our processes and workflows?
- Context (C): What are we missing? Has anything changed in the context over the years?
Examples of Effective QA Metrics and Dashboards
Good QA metrics are more than just numbers. They’re mirrors. They show the truth. They guide action. They make things tangible. Here are a few examples of QA metrics and dashboards that I’ve seen succeed:
1. Customer-reported issues dashboard:
This metric helps track new features, early issues, turnaround time, as well as reasons for hotfixes. This metric provides immediate insight and helps you identify where testing efforts need to be intensified.
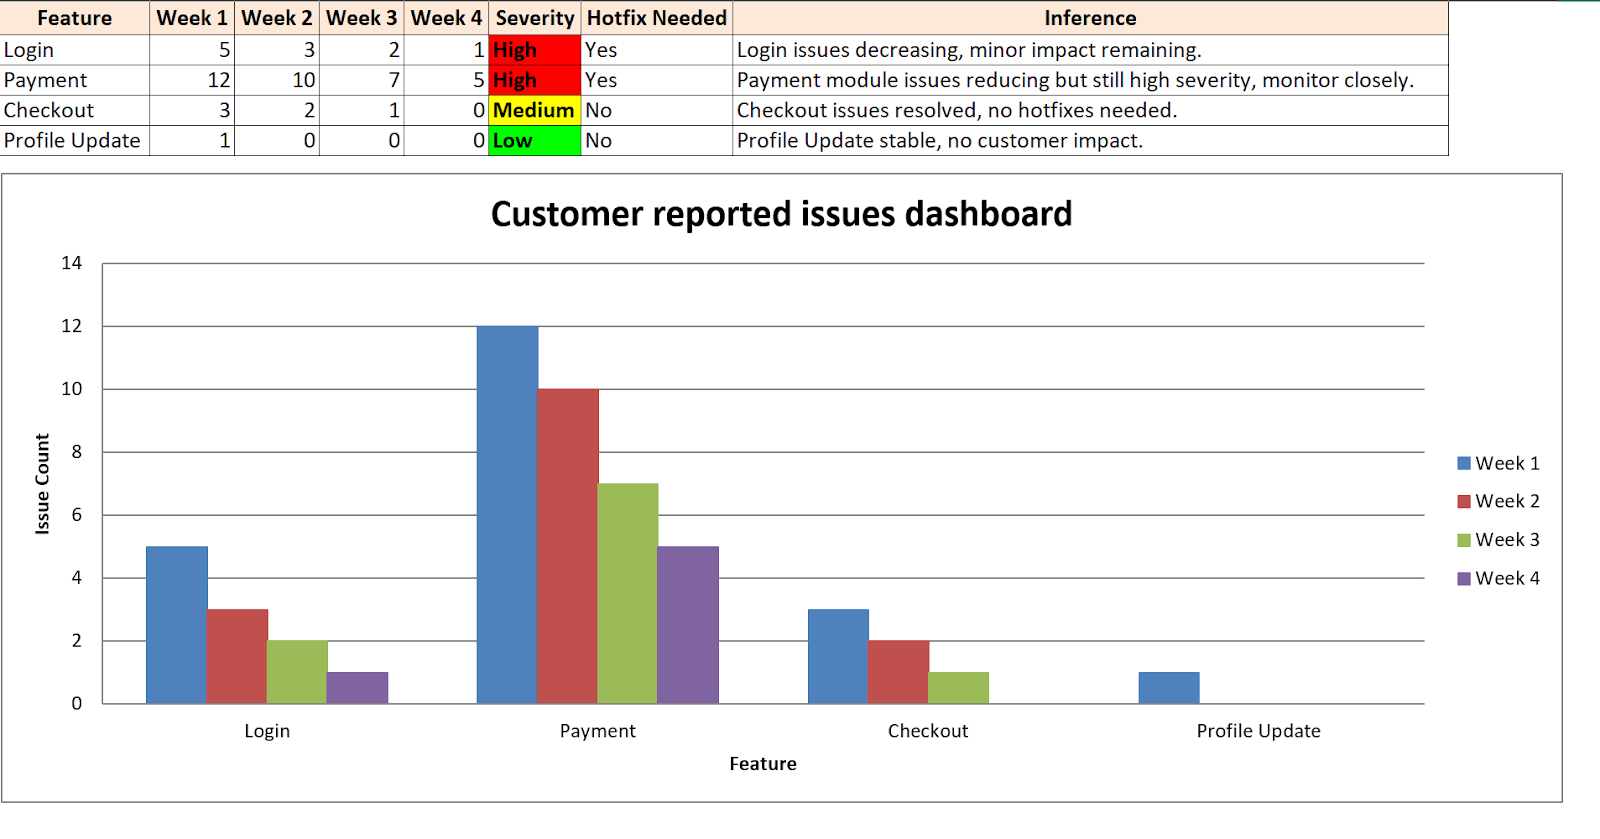
Customer-reported issues dashboard: Weekly view of defects by feature, severity, and business impact
2. Critical user journey stability dashboard:
This metric showcases daily RAG status for key workflows. This highlights fragile areas before they crack for the users. This helps executives see risk instantly. It also enables testing teams to act fast.
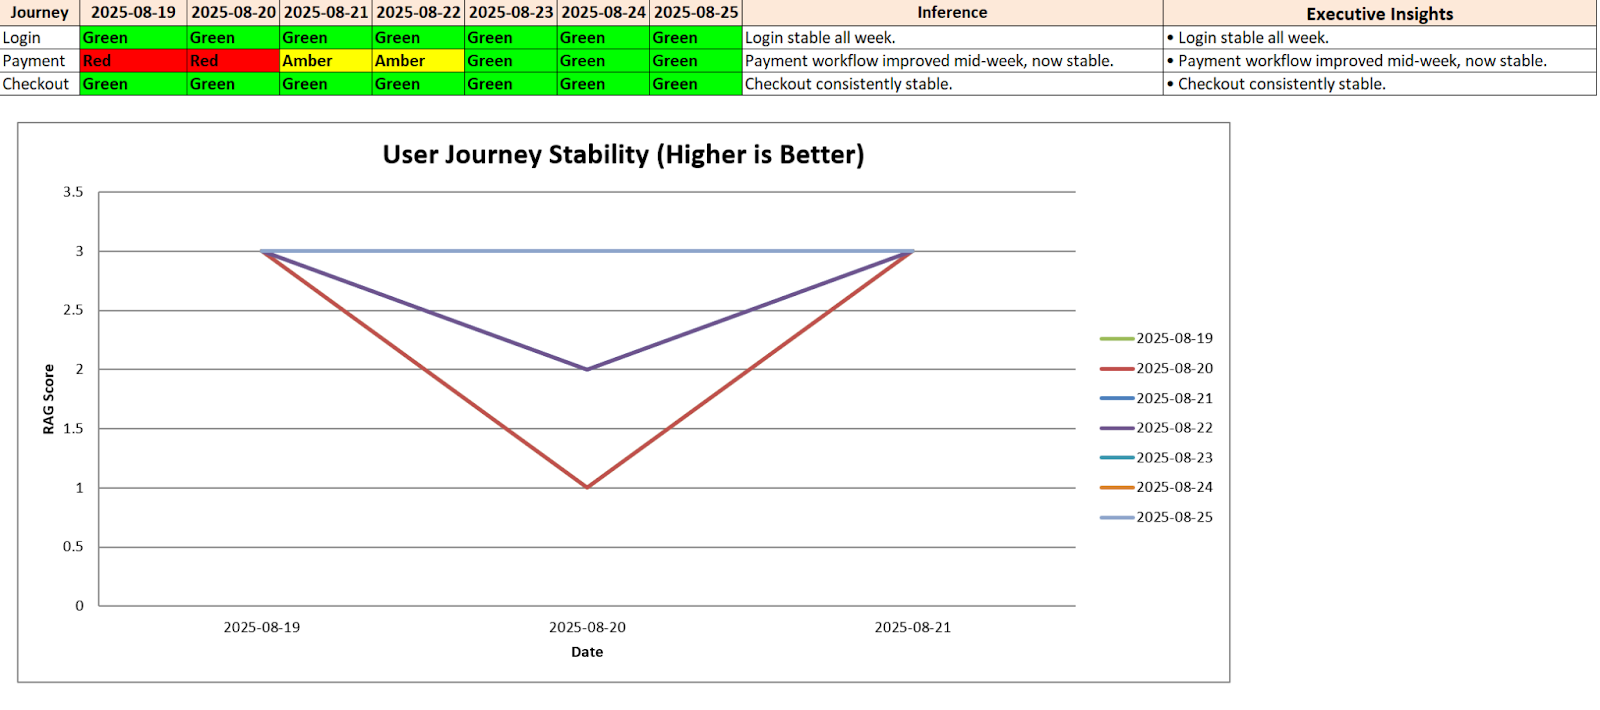
Critical user journey stability dashboard: Tracks the health of core workflows using daily status
3. Time Distribution Dashboard:
This metric displays how the testing team allocates its time: exploratory testing, regression testing, firefighting, production support, etc. It also reveals if the team is reactive or proactive in their approach.
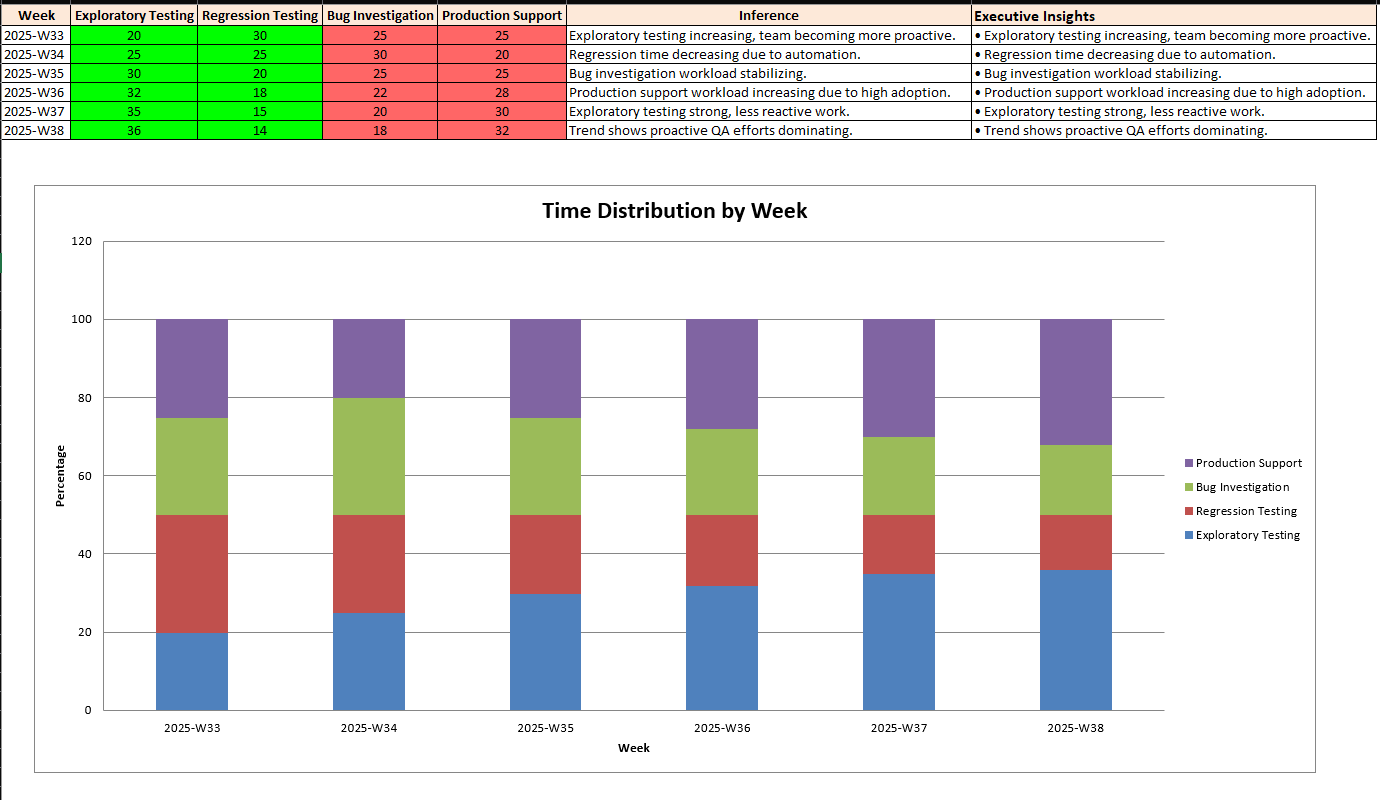
Time distribution dashboard: Visualizes how testing effort is spread across various activities
If you are looking for inspiration for various kinds of QA metrics that are popular in our industry, check out this comprehensive article on QA metrics.
How to Choose the Right QA Metrics
By now, we have understood how metrics can both enable and disable projects. They are a good tool if used wisely. That is why it is crucial that before adding any metric, you pause. And, try to uncover each of these aspects:
- Attribute: What are you trying to understand?
- Instrument: How are you going to measure it? Can people game the numbers?
- Relationship: Does the metric accurately reflect reality?
- Side effects: Could this create the wrong incentives for team members?
- Purpose: Why does this metric matter for our project?
- Scope: Should we apply it to a specific team, project, or the entire organization?
Skipping these questions leads to dashboards full of glitter and no gold.
Steps to Implement Meaningful QA Metrics in Testing
Start simple. Start with one meaningful metric. Track it well. Accuracy matters more than speed. Use spreadsheets at first. Once you can find the right metrics for your context, half the battle is already won. You can then automate the data collection later.
Golden tips for success:
- Start with light and simple metrics
- Don’t tie metrics to performance reviews.
- Pull data from sources such as Git, ALM, code repositories, etc.
- Ask how metrics can help improve team skills, tools, or efficiency.
- Drop metrics that stop serving their purpose.
- Report clearly: dashboards, one-page summaries, live counters.
- Include context. Metrics without context are confusing.
The New Way Forward
QA metrics are powerful. They are sharp tools. If you use them wisely, they will build trust. If used blindly, they lead to suffering. Focus on customer impact. Focus on critical workflows. Track how your team spends their time. Align testing metrics with business goals. Make reporting meaningful. Build trust with executives.
The next time you add a metric, ask: Does this help you improve your quality?
Quality isn’t about counting things. It’s about learning from them. The right metrics turn data into insight, and insights into better products.
When leaders understand which QA metrics actually matter, software testing becomes smarter, faster, and more aligned with business outcomes. And that’s when metrics finally matter.

Frequently Asked Questions
What are QA metrics in software testing?
QA metrics are measurements used to evaluate the effectiveness of testing. They track aspects such as escaped defects, turnaround time, and user journey stability to ensure that software quality aligns with business goals.
Why do some software testing metrics fail?
Metrics fail when they focus on easy-to-measure numbers (like bug counts or test case totals) instead of meaningful insights. These vanity metrics may look impressive, but they don’t improve quality or inform decision-making.
Which QA metrics matter most for business outcomes?
Actionable metrics, such as customer-reported issues, defect turnaround time, and the stability of critical workflows, matter most. They connect testing to customer experience and business success.
How can startups or scaling teams get started with meaningful QA metrics?
Many growing teams struggle to distinguish between vanity metrics and actionable ones. A partner like MuukTest can help by combining AI-driven automation with QA expertise to quickly highlight the metrics that truly matter for product quality and business alignment.
How can QA metrics build trust with executives?
Executives want context, not raw data. QA metrics build trust when they tell a clear story about risks, customer impact, and corrective actions supported by visuals and insights, not just numbers.